Hadjira Dakiche1,2 ![]() ,
Mustapha Khali1,
Ahmed Khaled Abu-el-Haija3,
Ammar Al-Maaytah3,
Qosay Ali Al-Balas3
,
Mustapha Khali1,
Ahmed Khaled Abu-el-Haija3,
Ammar Al-Maaytah3,
Qosay Ali Al-Balas3
For correspondence:- Hadjira Dakiche Email: s-dakiche@hotmail.fr Tel:+213555497211
Received: 20 June 2016 Accepted: 16 November 2016 Published: 20 December 2016
Citation: Dakiche H, Khali M, Abu-el-Haija AK, Al-Maaytah A, Al-Balas QA. Biological activities and phenolic contents of Argania spinosa L (Sapotaceae) leaf extract. Trop J Pharm Res 2016; 15(12):2563-2570 doi: 10.4314/tjpr.v15i12.5
© 2016 The authors.
This is an Open Access article that uses a funding model which does not charge readers or their institutions for access and distributed under the terms of the Creative Commons Attribution License (http://creativecommons.org/licenses/by/4.0) and the Budapest Open Access Initiative (http://www.budapestopenaccessinitiative.org/read), which permit unrestricted use, distribution, and reproduction in any medium, provided the original work is properly credited..
Purpose: To investigate the phenolic profile and biological activities of Argania spinosa L. leaves.
Methods: The crude methanol extract of leaves of A. spinosa L. Skeels was obtained by ultrasonic extraction, and the total polyphenolic and flavonoid contents were determined by ultra-high performance liquid chromatography-electrospray ionization-quadrupole time-of-flight-mass spectrometry (UPLC-ESI-QTOF-MS). In vitro antioxidant activity was determined by 2,2-di-phenyl-1-picryl-hydrazil (DPPH) radical assay and antimicrobial activity evaluated using agar disk diffusion method against reference pathogenic strains (Bacillus subtilis ATCC 6633, Bacillus cereus ATCC 14579, Yersinia enterocolitica ATCC 23715, Staphylococcus aureus ATCC 25923, Pseudomonas aeruginosa ATCC 27853, Escherichia coli ATCC 25922). Cytotoxic activity was evaluated by methyl-thiazolyldiphenyl-tetrazolium bromide (MTT) assay.
Results: The results revealed abundant polyphenols and flavonoids (221.39 ± 5.70 µg GAEq/1 g and 66.86 ± 3.36 µg CAEq/1 g, respectively) in the leaf extract. UPLC-DAD-ESI-QTOF-MS profiling showed the presence of myrecitin-3-galactoside, myrecitin-3-gluctoside, myrecitin-3-xyloside, quercetin-3-galactoside, quercetin-3-glucoside, quercetin-3-arabinofuranoside, and quercetin-3-rhamnoside. DPPH assay of the leaf extract yielded a half-maximal effective concentration (EC50) value of 125.60 ± 1.87 µg. A. spinosa L. leaves exhibited antibacterial activity against Gram (+) and Gram (-) bacteria, with particularly marked activity against B. subtilis (inhibition zone, 16 mm). Cytotoxicity data showed that the extract inhibited the proliferation of PC3 cells (IC50 ~ 600 µg).
Conclusion: A. spinosa L. leaf extract is rich in valuable biologically active compounds and could represent a new resource for natural and preventive therapies.
Introduction
Algeria has a diverse collection of flora, the majority of which may have therapeutic potential. Argania spinosa L., also known as the Argan tree, belongs to the Sapotaceae family and represents the only species of the genus Argania [1]. This species is the most original essence of North Africa and is endemic to Algeria, growing in the southwest of Tindouf Province, from the Jebel Ouarkziz to Hamada, and in south-western Morocco [2]. This tree has been successfully cultivated in some regions of northern Algeria, such as Stidia (Mostaganem Province), Chlef, and Mascara.
Due to the presence of Argan oil, which has, for centuries, been used in the traditional treatment of rheumatism, constipation, diabetes, and respiratory difficulties, as well as wounds and dry skin, the seed kernel is the most valuable part of A. spinosa L. [3]. To date, the use of by-products or parts of Argan trees other than the kernel has been limited (e.g., Argan leaves are used only in livestock feed). This represents an economic loss due to its content of bioactive compounds. Several phenolic compounds have been detected in A. spinosa L. leaves from Morocco; the main constituents are quercetin, hyperoside, and myricetin [4], which have antioxidant, antimicrobial, and cytotoxic activities [5].
The present study was conducted to investigate and explore the potential of Argan leaves as a by-product, analyze phenolic compounds using UPLC-DAD-ESI-QTOF-MS and assess the biological activities and pharmaco-toxicological properties (e.g., antioxidant, antibacterial, and cytotoxic effects) of leaves of the Argan tree.
Methods
Plant materials
A. spinosa L. leaves were collected in the Stidia region, Mostaghanem, north-western Algeria (latitude 35°48’N, longitude 0°03’E; altitude 35 m) from June to July 2014. The authentication was performed by Professor H. Abdelkrim (National Hight School of Agronomy, Algiers, Algeria). The voucher specimen was deposited in the herbarium of Laboratory of Protection and Valorization of Agro-biological Resources, University Saad Dahleb Blida, Algeria. The leaves were air-dried, powdered, and conserved until used.
Preparation of extract
Powdered A. spinosa L. leaves (20 g) were defatted using petroleum ether (60 – 80 °C) and then extracted with 200 ml of methanol/water (70/30, v/v) in an ultrasonic bath for 30 min. The solvent was then evaporated, and the extract was obtained with a yield of 13 %. The extract was stored in the dark at -20 °C until use.
Chemical analysis
Total polyphenol and flavonoid determination
The total phenolics in the methanolic extract were determined by the Folin and Ciocalteu method [6]. Gallic acid was used as the standard to generate a calibration curve, and measurements were carried out at 725 nm using a UV-vis spectrophotometer (Shimadzu UV 1650, Italy). The results were expressed as milligrams of gallic acid-equivalent per gram dry mass (mg GAE/g dry mass).
Total flavonoids were estimated according to the method of Grand et al [7]. Quercetin was used as the standard to generate the calibration curve, and measurements were carried out at 510 nm using a UV-vis spectrophotometer (Shimadzu UV 1650, Italy). Results were expressed as milligrams of quercetin-equivalent per gram dry mass (mg QAE/g dry mass).
Polyphenol characterization by UPLC–ESI–QTOF–MS
Polyphenolic compounds were identified using an Acquity Ultra-Performance LC system (UPLC) coupled to a XEVO-G2-QTOF (quadrupole time-of-flight) mass spectrometer (Waters Corporation, Manchester, United Kingdom), equipped with an electrospray ionization (ESI) source operating in positive and negative modes, using the binary solvent manager software (Waters Corporation, UK).
Chromatographic separation was carried out on a UPLC HSS T3, C18 column (1.8 μM, 2.1 × 100 mM, Waters Corporation) at 30 oC. The mobile phase comprised Solvent (A) (0.1 % formic acid, v/v) and Solvent (B) (100 % methanol). The gradient used was 0–5 min, 0–10 % B; 5–10 min, 10–15 % B; 10–15 min, 15-20 % B; 15–20 min, 20–30 % B; 20–30 min, 30-40 % B; and 30–35 min, 40-0 % B. The solvent flow rate was 0.4 mL/min. The injection volume was 2 μL.
Analysis was performed at a wavelength of 280 nm, data depending MS scanning from 50 to 1500 m/z. Analysis was performed in positive and negative ion modes using an electrospray source with a source temperature of 120 °C and a desolvation temperature of 500 °C, a capillary voltage of 1 kV, and a sampling cone voltage of 30 eV. Highly pure N2 (˃ 99.9995 %) was used as the desolvation gas (flow rate, 10 L/h) and cone gas (flow rate, 1000 L/H).
Data were acquired using the MassLynx software (version 4.1, Waters). The exact masses and MS fragmentation data were compared with those in the respect for phytochemicals and Mass Bank metabolomics data banks and in previous reports to identify phenolic compounds.
Antioxidant assay
DPPH assay of the methanolic extract of leaves of A. spinosa L was carried out as described by Blois [8]. Dried extract was weighed and reconstituted to known concentrations. The extract (0.3 mL) and a methanolic solution of DPPH (2.7 mL; 5 mg in 100 mL methanol) were mixed and incubated at room temperature for 1 h in the dark. The absorbance at 515 nm was then measured (Shimadzu UV 1650, Italy). A control solution was prepared with 0.3 mL methanol and 2.7 mL methanolic solution of DPPH. Ascorbic acid and Trolox were used as reference compounds. Radical scavenging activity is expressed as the percentage inhibition of DPPH (D) as in Eq 1.
D (%) = {(Ac – At)/Ac}100 …………… (1)
where Ac and As are the absorbance of control and test samples, respectively.
Antibacterial activity assay
Antimicrobial activity was determined against six strains of bacteria obtained from the American Type Culture Collection (ATCC) (Bacillus subtilis ATCC 6633, Bacillus cereus ATCC14579, Yersinia enterocolitica ATCC23715, Staphylococcus aureus ATCC 25923, Pseudomonas aeruginosa ATCC 27853, and Escherichia coli ATCC 25922), the identities of which were confirmed using a Microflex LT MALDI-TOF MS (Bruker Daltonics, 158 Bremen, Germany).
The antibacterial activity of the A. spinosa L. extract was evaluated using the disc diffusion method [9]. The extract was dissolved in DMSO to a final concentration of 50 mg/mL. The microbial strains were cultured on nutrient agar for 24 h. Then, a 200 µL aliquot of culture medium (106 colony-forming units (CFU) estimated based on the absorbance at 620 nm) was spread on Mueller-Hinton agar. Sterilized blank disks (6 mm in diameter) were impregnated with 25 µL of the prepared crude leaf extract and placed on the Mueller-Hinton agar plates. Tetracycline 30 µg/mL (TE 30) and DMSO were used as positive and negative controls, respectively. Plates were incubated at 37 °C for 24 h. The diameter of the inhibition zones was measured three times (experiments involved three replicates), and antibacterial activity was expressed as the mean inhibition zone diameter (mm).
Cytotoxicity assay
The PC-3 human prostate cancer cell line was used (ATCC). Cells were plated in RPMI 1640 medium supplemented with 10 % FBS and 1 % penicillin-streptomycin. All cultures were incubated at 37 °C in a humidified atmosphere containing 5 % CO2. Cells were plated at 5.0 × 10³/well in 96-well plates and allowed to attach for 24 h. Cells were then treated for 24 h under the conditions described above in the presence of 50–1000 μg/mL plant extract dissolved in DMSO followed by filtration through a 0.22-μm syringe filter. Stock solutions were further diluted in culture medium to the appropriate concentrations. DMSO (1 %) functioned as a vehicle control and had no effect on cell growth [10].
The methyl-thiazolyldiphenyl-tetrazolium bromide (MTT) assay, which is based on conversion of the yellow tetrazolium salt-MTT to purple formazan crystals by metabolically active cells, enables quantitative determination of viable cells. Briefly, 30 µL of MTT (5 mg/mL in PBS) were added to each well, and plates were incubated at 37 °C for 6 h. Formazan crystals were solubilized in 100 μL of DMSO by incubating at ambient temperature for 10 min. The absorbance at a wavelength of 570 nm was then determined using a microplate reader (Bio-Rad, USA). The results were expressed as the dose that inhibited growth of the control by 50 % (IC50) using a log10 plot of the drug concentration against the percentage of viable cells [11]. Tests were performed quintuplicate, and the mean inhibition (H) data were calculated using Eq 2.
H (%) = {(Ac – At)/Ac}100 …………… (2)
where Ac and As are the absorbance of control and test samples, respectively.
Statistical analysis
Data are presented as means ± standard deviation (SD) and were statistically analyzed using analysis of variance (ANOVA) for antioxidant results and a paired Student’s t-test for antibacterial findings. A value of p ≤ 0.05 was considered to indicate statistical significance. Analyses were carried out using Statistica software (version 6.0, StatSoft).
Results
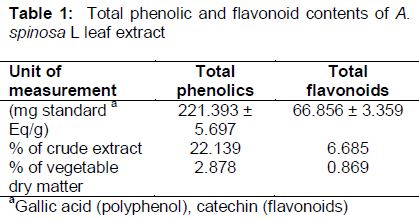
Total phenolic and flavonoid contents
The total phenolic content TPC () was 221.39 mg GAE/g. This was lower than that in a previous study [12], which reported that the TPC in an alcohol extract of A. spinosa L. leaves was 256.16 mg GAE/g. Additionally, the total flavonoid content (TFC; ) was 6.685 %. Fahmi et al [4] reported that the TFC in an alcohol extract was 4–17 %. The discrepancy may be because levels of phenolics and flavonoids are affected by plant maturity at harvest, growth conditions, geographic location, plant variety, and extraction time and method [13].
Characteristics of polyphenols
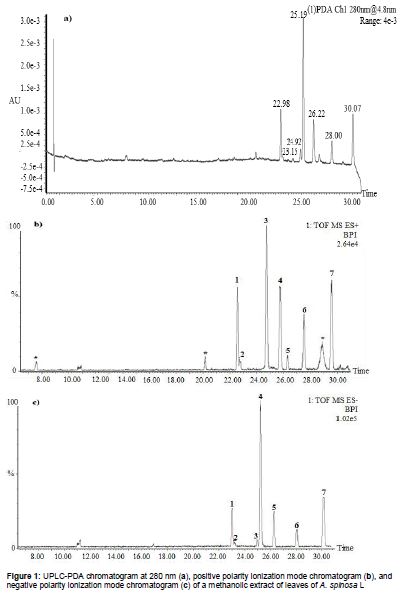
Hyperoside, quercetin, myricetin, and myrecitin-3-galactoside have been reported in the extract of A. spinosa L. leaves [4]. In the present work, flavonoids were detected in the extract of A. spinosa L. leaves. The resulting chromatogram recorded at 280 nm (a) and the base peak intensity (BPI) chromatogram showed nine peaks in ES+ (b) and six peaks in ES- (c) ().
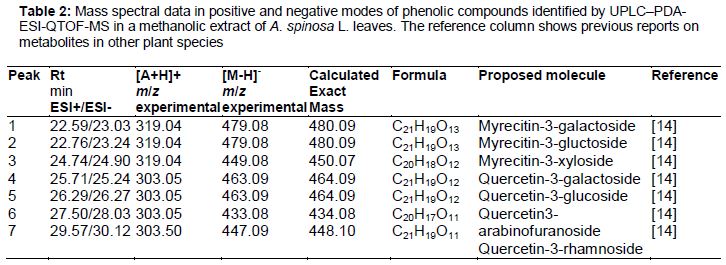
The most abundant phenolic compounds were flavonols (myricetin and quercetin and derivatives thereof). The tentative identities of these compounds based on the retention time, observed m/z, molecular formula, and MS fragments are shown in .
Two major flavonols and their glycoside derivatives were detected (i.e., quercetin and myricetin). The two ionization modes were also in agreement in terms of the identities of the flavonols and their glycoside derivatives. Polyphenols were detected as deprotonated and protonated molecules in both ionization modes, but they also showed a peak corresponding to the protonated aglycone [A+H] + in positive ESI [15]. Consequently, flavonols and their glycosides were identified by analyzing the extract in positive ESI mode and then by assigning all resulting peaks based on the deprotonated molecules. This enabled assignment of all isobaric compounds with different glycone moieties. In this study, protonated aglycone ions were present in the mass spectra as a result of the loss of the sugar residue (losses: 132, pentoside; 146, deoxyhexoside; 162, hexoside).
The mass spectra at m/z = 319.04 and m/z = 303.05 in ESI+ mode displayed peaks corresponding to the protonated aglycones [A+H]+ of myricetin glycoside derivatives and quercetin glycoside derivatives, respectively.
According to the elution order in the ESI- chromatogram (c), peaks 1, 2, and 3 were assigned to myrecitin-3-galactoside, myrecitin-3-glucoside, and myrecitin-3-xylosie with [M-H]- at m/z = 479.09, 479.09, and 449.09, respectively. Peak 4 was quercetin-3-galactoside (hyperoside) with [M-H]- at m/z = 463.09, followed by quercetin-3-glucoside (isoquercetin, peak 5) with [M-H]- at m/z = 463.09, which is isobaric with hyperoside. Peak 6 was identified as quercetin-3-arabinoside (avicularin) with [M-H]- at m/z = 434.08. The last quercetin derivative eluting peak (7) was quercetin-3- rhamnoside with [M-H]- at m/z = 447.09. The elution order of quercetin derivatives was in accordance with those reported in previous studies [16,17]. Compounds were detected in ESI- (c) at 7.60, 20.18, and 28.86 min with m/z at 118.06, 131.04, and 381.12, respectively. However, these molecules could not be identified.
Antioxidant activity
The antioxidant potential of A. spinosa L. leaf extract was determined by DPPH-scavenging assay. The A. spinosa L. leaf extract showed concentration-dependent antiradical activity.
The EC50 value of the extract was 125.595 ± 1.868 µg, whereas those of Trolox and ascorbic acid were 50.55 ± 0.785 and 23.238 ± 0.318 µg, respectively. Thus, the A. spinosa L. extract and the commercial antioxidants Trolox and ascorbic acid exhibited significantly different DPPH radical-scavenging activities (p < 0.05). The antioxidant activities were in accordance with those reported previously [12], but differences in the absolute values were expected due to the different chemical compositions.
Antibacterial activity
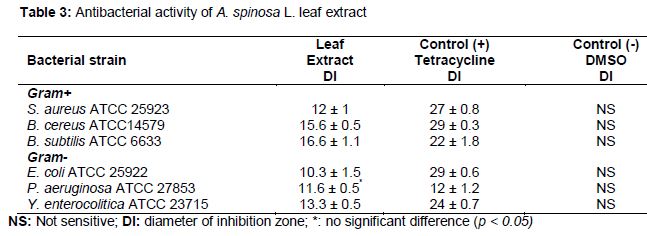
The antimicrobial activity of the A. spinosa L. leaf extract was tested against Gram-negative bacteria (E. coli, P. aeruginosa, and Y. enteroco- litica) and Gram-positive bacteria (S. aureus, B. cereus, and B. subtilis) ().
The leaf extract inhibited the growth of bacterial strains (inhibition zone diameters 12–17 mm for Gram (+) bacteria and 10–14 mm for Gram (-) bacteria. The extract exhibited the greatest activity against B. subtilis (16 mm), followed by B. cereus (15 mm) and S. aureus (12 mm). Regarding Gram (-) bacteria, the greatest activity was against Y. enterocolitica (13 mm), followed by P. aeruginosa (12 mm), and E. coli (11 mm). Tetracycline as a positive control showed inhibition zone diameters of 13–29 mm, possibly because the extract contained a mixture of various components [18]. Therefore, the A. spinosa L. leaf extract showed antibacterial activity against Gram positive and negative bacteria.
Cytotoxicity
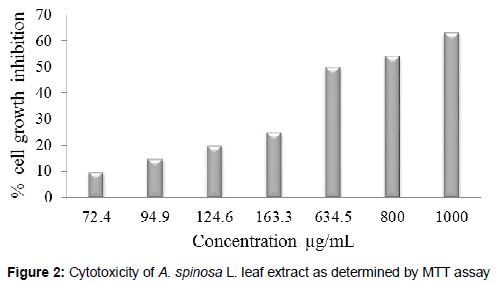
The cytotoxicity of the A. spinosa L. leaf extract (50–1000 µg/mL) was evaluated against PC3 human prostate cancer cells. The extract reduced the viability of PC3 cells significantly in a dose-dependent manner (). At concentrations of up to 70 µg/mL and 120 µg/mL, the extract was noted to induce 10 and 20 % of cell death, respectively. However, at a concentration of up to 600 µg/mL more than half of PC3 cells were destroyed and at a concentration of 1000 µg/mL, almost 63 % of PC3 cells were destroyed.
Discussion
UPLC-ESI-QTOF-MS facilitated the characterization of the major compounds in A. spinosa L. leaf extract using the fragmentation patterns determined by ESI-MS in positive and negative ion modes and the findings of previous studies.
The extract contained high levels of phenolic compounds, the majority of which were quercetin and myricetin derivatives. Additionally, the extract contained seven flavonols: myrecitin-3-galactoside, myrecitin-3-gluctoside, myrecitin-3-xyloside, quercitin-3-galactoside, quercitin-3-glucoside, quercitin-3-arabinofuranoside, and quercitin-3-rhamnoside. This represents the first phytochemical analysis of A. spinosa L. leaf extract by UPLC-DAD-ESI-QTOF-MS.
The antioxidant, antimicrobial, and cytotoxic properties of plants are mediated by different classes of phenolic compounds [5]. The present work is the first report of the antimicrobial and cytotoxic activities of A. spinosa L. leaf extract.
The A. spinosa L. leaf extract exhibited a considerable DPPH free radical-scavenging activity, with an IC50 value of ~125 µg. Phenolic compounds may contribute to antioxidant activity by donating electrons from their hydroxyl groups to reactive radicals, thus suppressing radical chain reactions [19]. Indeed, Cai et al [20] reported a significant correlation between antioxidant activity and TPC.
The A. spinosa L. leaf extract exhibited antibacterial activity against all Gram-positive and -negative strains tested. The extract had a considerable polyphenol content, which may explain its inhibition of bacterial growth. The antibacterial activity of plant extracts has been reported to be proportional to their TPC [21]. The quercetin and myricetin derivatives identified as the major phenolic compounds in A. spinosa L. leaf extract have been reported to exert antibacterial effects [22,23].
Furthermore, the A. spinosa L. leaf extract (0.6 mg) killed 50 % of PC3 human cancer cells. Some studies reported that the use of natural antioxidants can reduce the risk of various cancers, an effect seemingly mediated by phenolic compounds. This phenomenon may be due to the fine tuning of the cytoprotective mechanisms to prevent the development of premalignancy, inhibit cancer promotion, or block cancer progression [19,24]. Wätjen et al [25] reported that quercetin and myricetin can prevent the development of cancer by inducing cytotoxicity, DNA strand breaks, oligonucleosomal DNA fragmentation, and caspase activation.
Conclusion
This study is the first report of the chemical composition, and antimicrobial and cytotoxic activities of Algerian A. spinosa L. leaf extract. The leaf extract exhibited interesting biological proprieties, such as cytotoxic, antimicrobial, and antioxidant effects. These findings suggest the feasibility of further development of A. spinosa L. tree to yield therapeutically useful compounds.
Declarations
Acknowledgement
References
Archives


News Updates